Solving for Safety Submissions
The Solving for Safety Visualization Challenge is approximately a 3-stage challenge that includes 1 month for ideation development, 1 month for proof of concept development, and 2 months for full working analytical visualization tool development.

Stage III Winner
The University of Central Florida (UCF) was selected as the Challenge winner for developing a full working analytical visualization tool. Learn how UCF's tool could help reduce serious crashes on the Nation's road and rail system by viewing their Challenge profile.
University of Central Florida's Real-Time Crash Risk Visualization Tools for Traffic Safety Management
 Stage II Finalists
2 Stage II Finalists are advancing to Stage III, developing their proofs of concept into full working analytical visualization tools. Learn how the finalists propose to reduce serious crashes on the Nation's road and rail system by viewing their Challenge profiles.
Ford Motor Company's RoadCode
University of Central Florida's Real-Time Crash Risk Visualization Tools for Traffic Safety Management
 Stage I Semi-finalists
5 Stage I semi-finalists are advancing to Stage II, developing their ideations for an analytical visualization tool into a proof of concept. Learn how the semi-finalists propose to reduce serious crashes on the Nation's road and rail system by viewing their Challenge profiles.
Arity's City Data Platform
Ford Motor Company's RoadCode
Uber's USDOT Safety with Uber’s Kepler.gl
University of Central Florida's Real-Time Crash Risk Visualization Tools for Traffic Safety Management
VHB's My Street
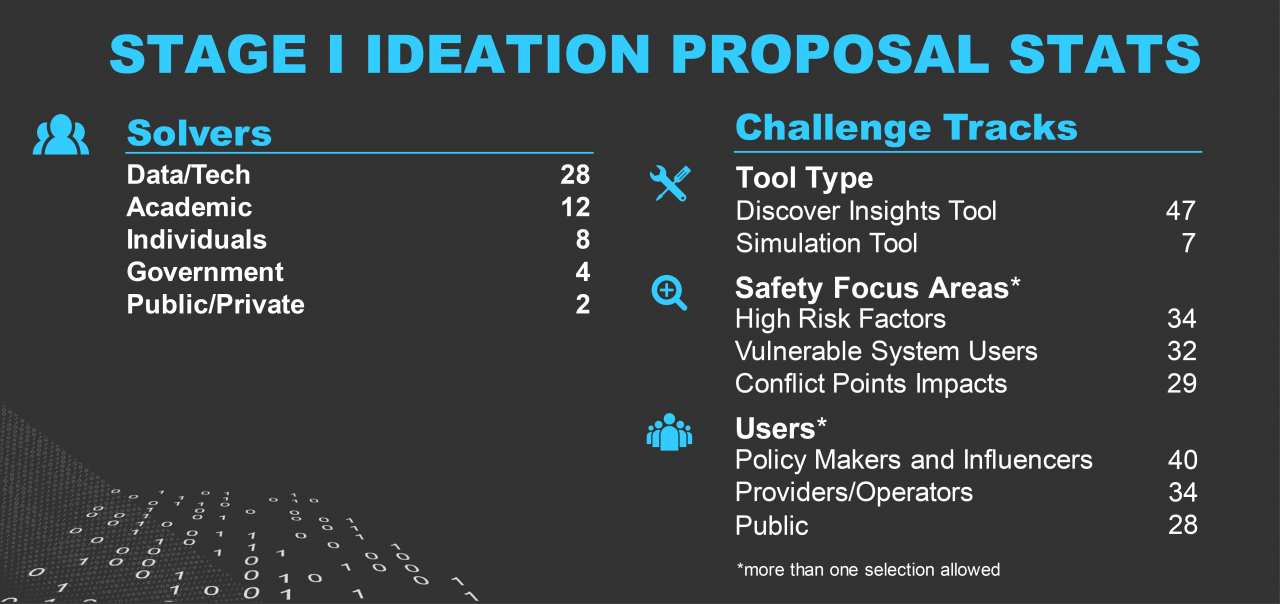
 Stage I Solvers
54 Solvers took up the Challenge to Solve for Safety by submitting an ideation for an analytical visualization tool! Learn how these innovators proposed to reduce serious crashes on the Nation's road and rail system by reading the brief descriptions below.
Lite-Check Fleet Solutions, Inc.
Device and Process of Collecting Post Accident Vehicle Data
Method of producing analytic vehicle post accident report on site.
Challenge Tracks: Discover Insights Tool for Providers/Operators focused on Conflict Points Impacts
Virginia DOT
Development of An Advanced Systemic Approach and Visualization Tool for Unsignalized Intersection Safety
Develop systemic analysis visualization tool for improving safety at unsignalized intersection.
Challenge Tracks: Simulation Tool for Providers/Operators and Public focused on Conflict Points Impacts
Innovate, LLC
Traffic Safety Visualization App To Reduce Serious Crashes
Analyze data to reveal patterns and trends, and use compelling visualizations to explain what is happening, understand the meaning behind the data, and draw conclusions.
Challenge Tracks: Discover Insights Tool for the Public focused on Vulnerable System Users
Bushnick Innovations
Bushnick Innovations
Transforming the American Auto Industry into the largest road quality data provider of the future.
Challenge Tracks: Discover Insights Tool for Policy Makers and Influencers focused on High Risk Factors
Rhode Island Department of Transportation, VHB, ESRI
Safety in Numbers: RIDOT Uses Traffic Data to Solve for Safety
Analyzing traffic safety risk using GIS models overlaying RIDOT’s Transportation Asset Management Plan (TAMP) and Transportation Improvement Program (TIP) data.
Challenge Tracks: Discover Insights Tool for Policy Makers and Influencers, Providers/Operators, and the Public focused on Conflict Points Impacts, High Risk Factors, Vulnerable System Users
University of Central Florida
Real-Time Crash Risk Visualization Tools for Traffic Safety Management
Real-Time Crash Risk Visualization using Integrated Tools for Traffic Safety Evaluation and Management.
Challenge Tracks: Simulation Tool for Policy Makers and Influencers and Providers/Operators focused on Conflict Points Impacts
Weris, Inc.
Driver Safety Assistant
A Safety Alert App Using State DOT Traffic Incident Data and AI to Notify Drivers/Operators of Incident Patterns.
Challenge Tracks: Discover Insights Tool for Policy Makers and Influencers, Providers/Operators, and the Public focused on Conflict Points Impacts, High Risk Factors, and Vulnerable System Users
Teach America
Corridor Visualization Explorer 2.0
Visually compare the safety impacts of medians versus two-way-left-turn lanes.
Challenge Tracks: Discover Insights Tool for Policy Makers and Influencers, Providers/Operators, and the Public focused on Conflict Points Impacts
James Adams, Scott Morrison, Dustin Engelhaupt, Andrew Goodrick, Nolan Jones
No Distraction is Worth Your Life
Do news alerts sent to smartphones contribute to motor vehicle accidents.
Challenge Tracks: Discover Insights Tool for Policy Makers and Influencers focused on High Risk Factors
Xompass
Edge Video Analytics for Safety Visualization
Use existing street cameras to analyze, identify in real time Conflict Points Impacts for advance analytics.
Challenge Tracks: Discover Insights Tool for Policy Makers and Influencers, Providers/Operators, and the Public Conflict Points Impacts
Columbia University, Smart Cities Center of the Data Science Institute and New York City DOT, Division
Visualizing and Learning Road Safety Performance from Large Fleet Driver Behavior Data
High resolution driver safety behavior indices visualization and mapping from large vehicle fleet telematics data.
Challenge Tracks: Discover Insights Tool for Policy Makers and Influencers and Providers/Operator focused on Conflict Points Impacts, High Risk Factors and Vulnerable System Users
Booz Allen Hamilton
It’s in Your Hands: Understanding Your Driving Decisions & Safety
Empowering users with the full picture they need to make safer driving decisions.
Challenge Tracks: Discover Insights Tool for Policy Makers and Influencers and the Public focused on High Risk Factors
PencilDATA
PencilDATA DOT Application
How we can help prevent future accidents.
Challenge Tracks: Discover Insights Tool for Providers/Operators focused on Conflict Points Impacts
University of California, Riverside; Toyota Info Technology Center, USA
Agent-Based Modeling and Simulation of Connected and Automated Vehicles Using Game Engine
Develop virtual prototype for connected and automated vehicles by Unity3D game engine.
Challenge Tracks: Simulation Tool for Policy Makers and Influencers, Providers/Operators, and the Public focused on Conflict Points Impacts, High Risk Factors, and Vulnerable System Users
Center For Advanced Transportation Technology Laboratory
Highway Safety Impact Analysis Suite
Tackling Highway Safety with Data Fusion and Visualization.
Challenge Tracks: Discover Insights Tool for Providers/Operators focused on Conflict Points Impacts, High Risk Factors, and Vulnerable System Users
Transit X
Reaching Vision Zero Safety Through Car-Free Podways
Provide education and tools to show how everyone can reach Vision Zero Safety with Podways.
Challenge Tracks: Discover Insights Tool for Policy Makers and Influencers and the Public focused on Conflict Points Impacts, High Risk Factors, Vulnerable System Users
Arcadis U.S., Inc.
Safe BR
Safe BR links the transportation system’s most vulnerable users with data to address safety needs.
Challenge Tracks: Discover Insights Tool for Policy Makers and Influencers and the Public focused on High Risk Factors and Vulnerable System Users
Avineon, Inc
Transportation Accident Data Visualization and Exploration
A web-based tool to facilitate accident visualization, data exploration, analysis, and insight development.
Challenge Tracks: Discover Insights Tool for Policy Makers and Influencers and Providers/Operators focused on Conflict Points Impacts, High Risk Factors, and Vulnerable System Users
University of Central Florida
SAVE: A Safety Analytics and Visualization Engine for Gathering Insights on Vulnerable Road Users
SAVE will combine traffic and crash data, visualize users and crash risks, and provide potential solutions.
Challenge Tracks: Discover Insights Tool for Providers/Operators focused on Vulnerable System Users
Texas A&M Transportation Institute
Real-time Ped-Bike Vulnerability Mapping Tool for the U.S.
This tool will develop real-time ped-bike exposure, fatal crashes, and vulnerability scores across the U.S.
Challenge Tracks: Discover Insights Tool for Policy Makers and Influencers focused on Vulnerable System Users
Ford Motor Company
RoadCode
Make smarter safety choices by unlocking driver behavior codes hidden in near misses and perceptions.
Challenge Tracks: Simulation Tool for Providers/Operators focused on High Risk Factors
VHB
My Street
An evidence-based tool that helps the decision-maker “see” safety improvements from the pedestrian’s perspective.
Challenge Tracks: Discover Insights Tool for Policy Makers and Influencers, Providers/Operators, and the Public focused on Vulnerable System Users
Hassan Dibadj, Masoud Hamedi
Impactful Visualizing for Policy makers Based on Cognitive Models
Tailoring data analysis and visualizations for the most effective communication in the policy and legal environment.
Challenge Tracks: Discover Insights Tool for Policy Makers and Influencers focused on High Risk Factors
Guidehouse LLP
GuideSafe Discovery Insight Tool
How safe is your route? An interactive way to visualize the risk of routes and intersections.
Challenge Tracks: Discover Insights Tool for Policy Makers and Influencers, Providers/Operators, and the Public focused on Conflict Points Impacts
Oklahoma Dept. of Transportation
An Analysis of Road Assets and Vehicle-related Crashes in Oklahoma
Our inexpensive and easy to deploy comprehensive analysis and predictive toolbox combines traditional crash and asset information with broad demographic data in a robust and intuitive package.
Challenge Tracks: Discover Insights Tool for Policy Makers and Influencers, Providers/Operators, and the Public focused on Conflict Points Impacts, High Risk Factors, and Vulnerable System Users
Uber
USDOT Safety with Uber’s Kepler.gl
Our solution combines Kepler.gl and Uber’s historical speed data to visualize traffic safety insights.
Challenge Tracks: Discover Insights Tool for Policy Makers and Influencers focused on Conflict Points Impacts
Arity
City Data Platform (formerly known as, Arity Safety Insights Tool)
Incorporates Arity safety-related driving behavior data with other contextual data sources to help transportation planners/providers.
Challenge Tracks: Discover Insights Tool for Policy Makers and Influencers and Providers/Operators focused on Conflict Points Impacts, High Risk Factors, and Vulnerable System Users
AECOM, Teezle, Futurus
Safest Route and Crash Insight Analytics
Enhanced safety analytics, context-sensitive visual tools, and safety-based driver routing information and selection.
Challenge Tracks: Discover Insights Tool for Policy Makers and Influencers, Providers/Operators, and the Public focused on High Risk Factors and Vulnerable System Users
Texas A&M Transportation Institute
Pedestrian & Bicycle Safety Hot Spot Analytical Tool
Pedestrian & Bicycle Safety Hot Spot Analytical Tool.
Challenge Tracks: Discover Insights Tool for Policy Makers and Influencers focused on Conflict Points Impacts, High Risk Factors, and Vulnerable System Users
San Francisco Department of Public Health, Program on Health, Equity and Sustainability
Transportation Injury Query System (TIQS): Using Hospital Patient Data from Zuckerberg San Francisco General Hospital for Discovery Insights into Traffic Safety
Visualizing severe injuries to vulnerable users using hospital data to advance San Francisco’s Vision Zero.
Challenge Tracks: Discover Insights Tool for Policy Makers and Influencers, Providers/Operators, and the Public focused on Vulnerable System Users
Center for Urban Transportation Research (CUTR) at the University of South Florida
REV-M
Research and Visualization for Motorcycles.
Challenge Tracks: Discover Insights Tool for Policy Makers and Influencers and the Public focused on Vulnerable System Users
IPC Global Services
Data Driven Intervention and Enforcement
Comprehensive solution that allows US and State DOTs to make confident, data-driven decisions on-demand.
Challenge Tracks: Discover Insights Tool for Policy Makers and Influencers, Providers/Operators, and the Public focused on Conflict Points Impacts, High Risk Factors, and Vulnerable System Users
Timothy Han
CrashMap
An intuitive crash data visualization tool that everyone can use.
Challenge Tracks: Discover Insights Tool for Policy Makers and Influencers, Providers/Operators, and the Public focused on High Risk Factors and Vulnerable System Users
University of New Mexico, University of Colorado Denver
A Proactive Look at Pedestrian and Bicyclist Safety
Proactively visualizing pedestrian and bicyclist safety issues allows users to detect macro-patterns and identify micro-solutions.
Challenge Tracks: Discover Insights Tool for Policy Makers and Influencers, Providers/Operators, and the Public focused on Conflict Points Impacts, High Risk Factors, and Vulnerable System Users
Mcity
Mcity Data Gauge
A tool for discovery by filtering, aggregating, visualizing, and annotating vulnerable road user behavior patterns.
Challenge Tracks: Discover Insights Tool for Providers/Operators focused on Vulnerable System Users
Blyncsy
Blyncsy Synapse - Analytical Visualization Tool for Safety Insights at Intersections
Blyncsy Synapse streamlines creation and analysis of intersection collision diagrams with integrated traffic data.
Challenge Tracks: Discover Insights Tool for Policy Makers and Influencers, Providers/Operators, and the Public focused on Conflict Points Impacts and High Risk Factors
Pooya Najaf
County Level Transportation Safety Planning Tool
A tool for county-level transportation safety planning.
Challenge Tracks: Simulation Tool for Policy Makers and Influencers focused on High Risk Factors
Numetric
Numetric Crash Query & Safety Analysis Modules
Numetric gives users the ability to quickly filter their data to visualize and uncover trends.
Challenge Tracks: Discover Insights Tool for Providers/Operators focused on High Risk Factors and Vulnerable System Users
Amisha Bhanage, Xia Song, Amit Chourasia
My Trip Risk Information Platform (MyTrip)
Improve safety by enabling public to assess risk for any trip and minimize risky behaviors.
Challenge Tracks: Discover Insights Tool for the Public focused on High Risk Factors
Citilabs
RIDESAFE
Cycling Safely App from Citilabs.
Challenge Tracks: Discover Insights Tool for Policy Makers and Influencers, and the Public focused on Vulnerable System Users
Esri
Safe Driver Assist
Safe Driver Assist is a driver notification application intended to help drivers better navigate high-risk road segments without infrastructure costs to transportation and operations agencies.
Challenge Tracks: Discover Insights Tool for Policy Makers and Influencers and the Public focused on Conflict Points Impacts and High Risk Factors
Open Data Nation
Smart City Evolution: Helping Policymakers Become Proactive, Rather than Reactive
Shift from analyzing historical data to a proactive solution for preventing pedestrian and cyclist crashes and saving lives.
Challenge Tracks: Discover Insights Tool for Policy Makers and Influencers and Providers/Operators focused on High Risk Factors
Roy Fleshman
A 360 Degree View of Roadway Safety
A comprehensive data visualization analytical tool which brings together aspects and factors of roadway safety.
Challenge Tracks: Discover Insights Tool for Policy Makers and Influencers, Providers/Operators, and the Public focused on Conflict Points Impacts, High Risk Factors, and Vulnerable System Users
CurbZERO
USAAID.org (US Airports Against Impaired Driving)
Airport/street cameras detect impaired driving. We develop actionable policies for airports and cities.
Challenge Tracks: Discover Insights Tool for Policy Makers and Influencers, Providers/Operators, and the Public focused on High Risk Factors and Vulnerable System Users
Caresoft Global Inc
Solution for Safety: Visualization Challenge
Caresoft proposes to develop analytical visualisation tool to emphasis focus on safety and crash prevention.
Challenge Tracks: Simulation Tool for Providers/Operators and the Public focused on Conflict Points Impacts, High Risk Factors, and Vulnerable System Users
Esri
Safe Roads Plus
Simulation Tool for Policy Makers and Influencers focused on Conflict Points Impacts, High Risk Factors
Challenge Tracks: Safe Roads Plus is a transportation safety simulation tool package intended to help users expand on Abley’s Safe Roads package, leveraging the latest advancements in spatial machine learning to model probabilities of fatal or severe injury in crashes
Maryam Shirinzad
Crashmap
A crash mapping suite to collect, store, map and extract Geocoded crash data.
Challenge Tracks: Discover Insights Tool for Providers/Operators focused on Conflict Points Impacts
University of Tennessee
Crashes involving humans need more information about the human.
Introducing home-based approach: a complementary method to explore safety through learning crash victim’s sociodemographic surroundings.
Challenge Tracks: Discover Insights Tool for Policy Makers and Influencers and the Public focused on High Risk Factors and Vulnerable System Users
Kalman & Company, Inc.
Advanced Dashboards for Vulnerable System User Incidents
Discovering insights of vulnerable system user incidents through dashboarding datasets derived from data classifications methods.
Challenge Tracks: Discover Insights Tool for Policy Makers and Influencers focused on Vulnerable System Users
Montana Association of Counties
Rural Transportation Safety Visualization Risk Mitigation Proposal
Vehicle accident data Idaho and Montana combined into one source for a discover insights tool.
Challenge Tracks: Discover Insights Tool for Policy Makers and Influencers focused on Conflict Points Impacts and Vulnerable System Users
Volanno
Volanno’s Tableau Solution for Solving for Safety Visualization Challenge
Implementing Tableau and expert data analysis skills to produce data visualizations for policy makers and influencers
Challenge Tracks: Discover Insights Tool for Policy Makers and Influencers focused on High Risk Factors and Vulnerable System Users
Richard Li, University of Louisville
A Proactive Approach for Intersection Safety Visualization based on Real-time Radar Sensor Data
A Proactive Approach for Intersection Safety Visualization based on Real-time Radar Sensor Data.
Challenge Tracks: Discover Insights Tool for Providers/Operators focused on Conflict Points Impacts and Vulnerable System Users
Hyeonsup Lim, Sangseob Leem
VIS
Visually Interactively Solving safety
Challenge Tracks: Discover Insights Tool for Providers/Operators focused on High Risk Factors
VersaTech, emdata
Visual Analysis for Safety Insights
Analyzes data to reveal patterns and trends using compelling visualizations
Challenge Tracks: Discover Insights Tool for Policy Makers and Influencers, Providers/Operators, and the Public focused on Conflict Points Impacts, High Risk Factors, and Vulnerable System Users
|
|