The Roadway Safety Problem
Over many decades, the United States has experienced reductions in roadway fatalities through successful interventions like the widespread use of seat belts and air bags in motor vehicles, effective State laws such as a 0.08 or lower blood alcohol concentration limit to reduce impaired driving, and consistent improvement of roadway design and traffic operation practices.
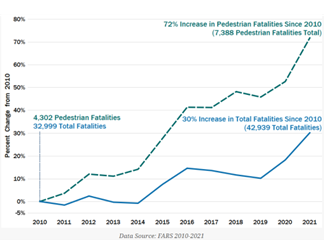
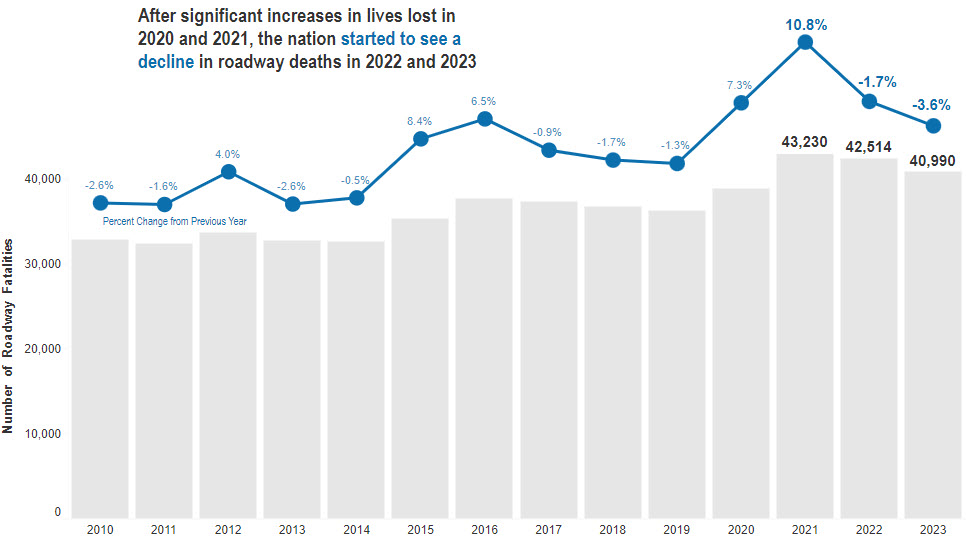
Roadway fatalities and the fatality rate declined consistently for 30 years, but progress stalled over the last decade and went in the wrong direction in 2020 and 2021. In 2021, 43,230 people were killed in motor vehicle crashes, of which 7,388 were people walking. Millions more were injured – sometimes permanently – each year. This was the highest number of fatalities since 2005.
Source: NHTSA
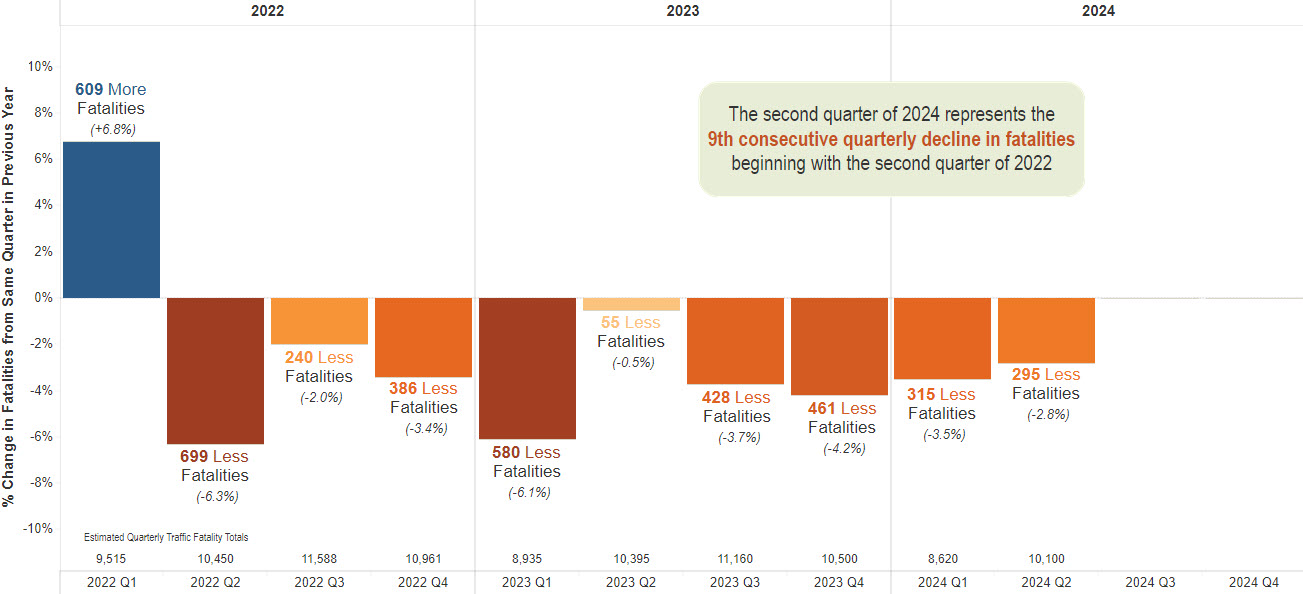
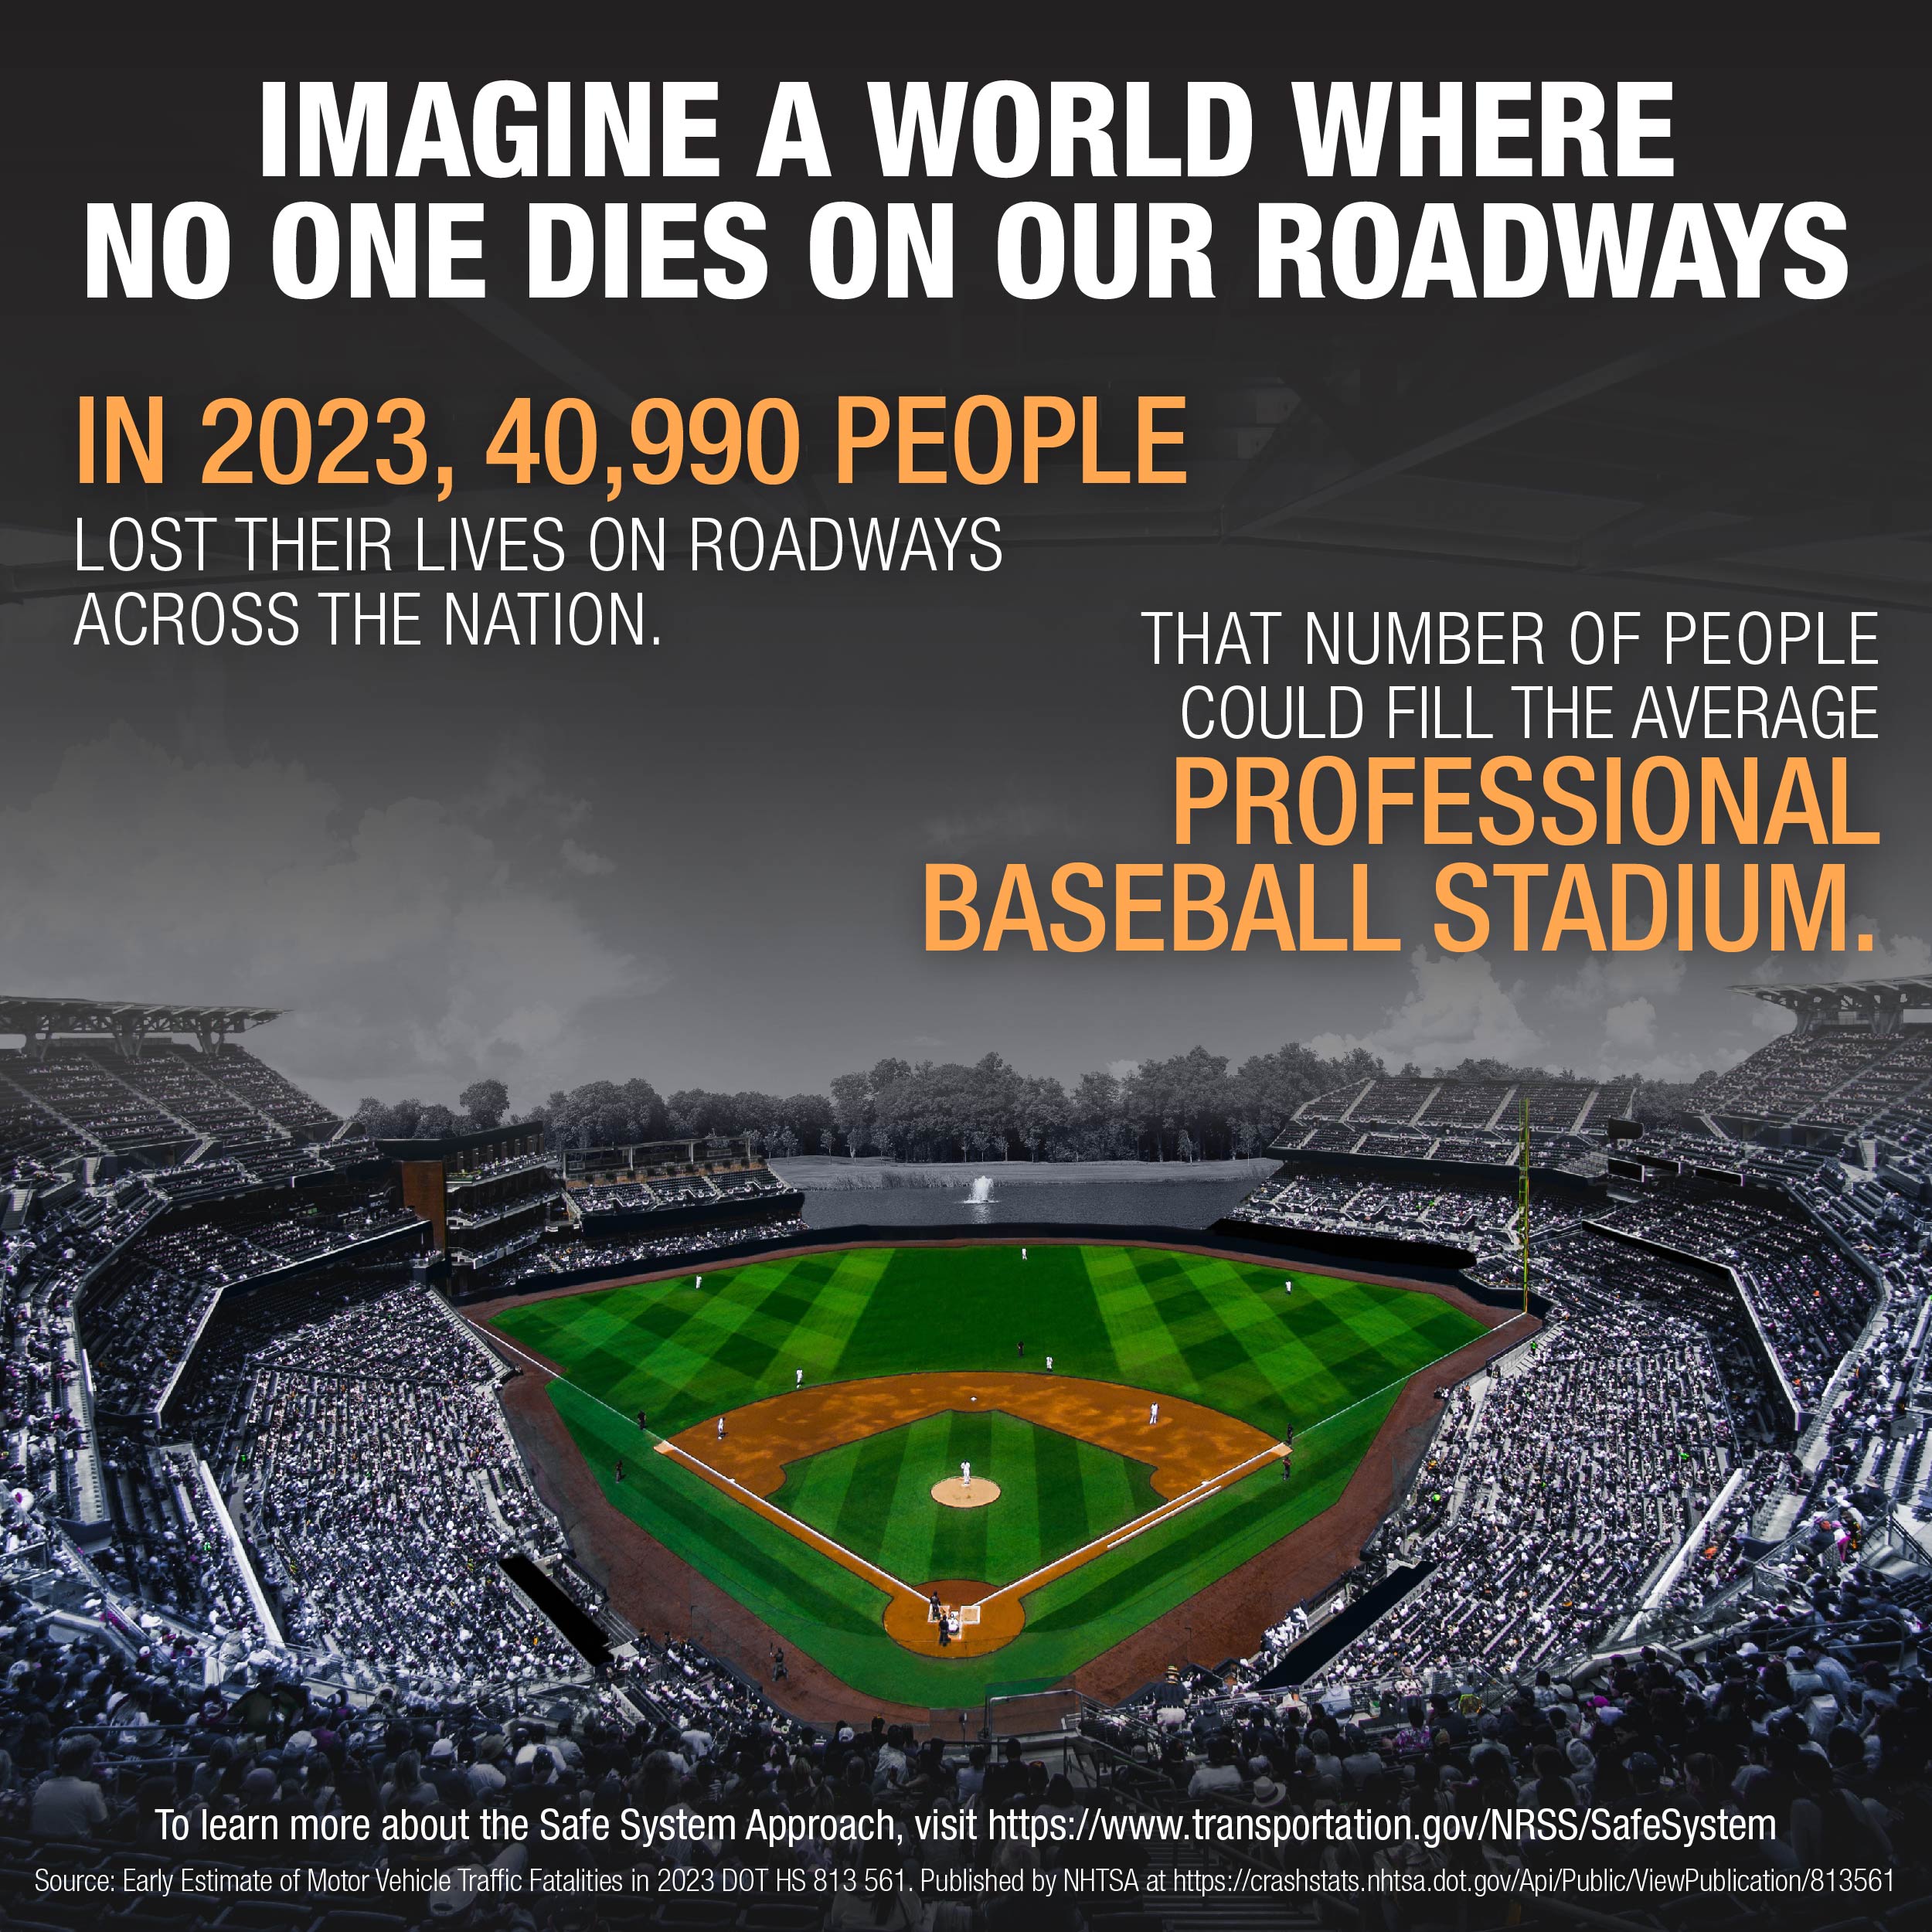
However, improvements began to show up in 2022 and have continued through 2023 and into 2024. In 2022, 42,514 lives were lost on U.S. roads, an increase of over 10% compared to 2020 but a slight decrease of 0.3 percent from 2021. Early estimates for 2023 show a continued decline to an estimated 40,990 roadway deaths – a 3.6 percent reduction from 2022 – which has continued into the first half of 2024.
Source: Fatality Analysis Reporting System
Our Nation's Roadway Safety Crisis
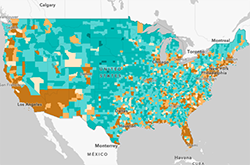
Explore interactive data visualizations to learn about the significant impact of motor vehicle deaths in our communities and where progress is being made in eliminating roadway deaths.
Our Nation's Pedestrian Safety Crisis
Pedestrian safety starts with addressing the challenges as a system. This StoryMap highlights three important areas that are common factors in many fatal crashes involving pedestrians where changes to the system can improve pedestrians' safety.