
Round One: 78 Applications From Across America
While the cities were diverse, many of the 78 applicants faced similar urban mobility challenges:
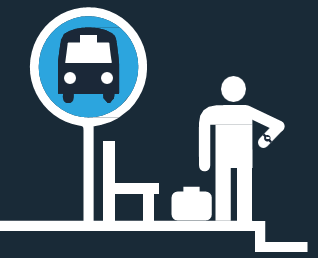
Providing first-mile and last- mile service for transit users to connect underserved communities to jobs
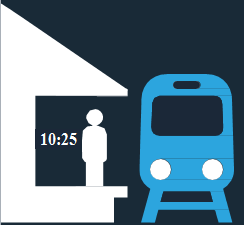
 The typical job is accessible to only about 27 percent of its metropolitan workforce by transit in 90 minutes or less.
Facilitating the movement of goods into and within a city
 Trucks stuck in stop-and-go traffic in metropolitan areas cost shippers an estimated $28 million annually in truck operating costs and wasted fuel.
Coordinating data collection and analysis across systems and sectors
 28 percent of all of the transit agencies in the United States have open data systems that freely provided transit times to the public.
Reducing inefficiency in parking systems and payment
 An estimated 30 percent of traffic in urban areas is caused by cars looking for parking.
Limiting the impacts of climate change and reducing carbon emissions
 The 78 applicant cities represent over one billion metric tons of CO2 emissions per year.
Optimizing traffic flow on congested freeways and arterial streets
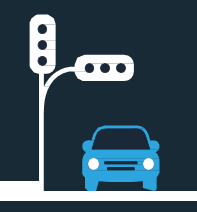 Outdated traffic signal timing causes more than 10 percent of all traffic delay on major routes in urban areas.
Download their applications now:
Click here to see all 78 vision statements from the first round.