
Air Travel Consumer Report: September 2019 and 3rd Quarter 2019 Numbers
WASHINGTON – The U.S. Department of Transportation (DOT) today released its November 2019 Air Travel Consumer Report (ATCR) on reporting marketing and operating air carrier data compiled for the month of September 2019. The full consumer report and other aviation consumer matters of interest to the public can be found at http://www.transportation.gov/airconsumer.
September On-Time Performance
In September 2019, reporting marketing carriers posted an on-time arrival rate of 84.1%, up from both the 77.6% on-time rate in August 2019 and from 81.9% in September 2018.
For the first nine months of 2019, the reporting marketing carriers posted an on-time arrival rate of 78.1%, down from 78.7% for the same period in 2018.
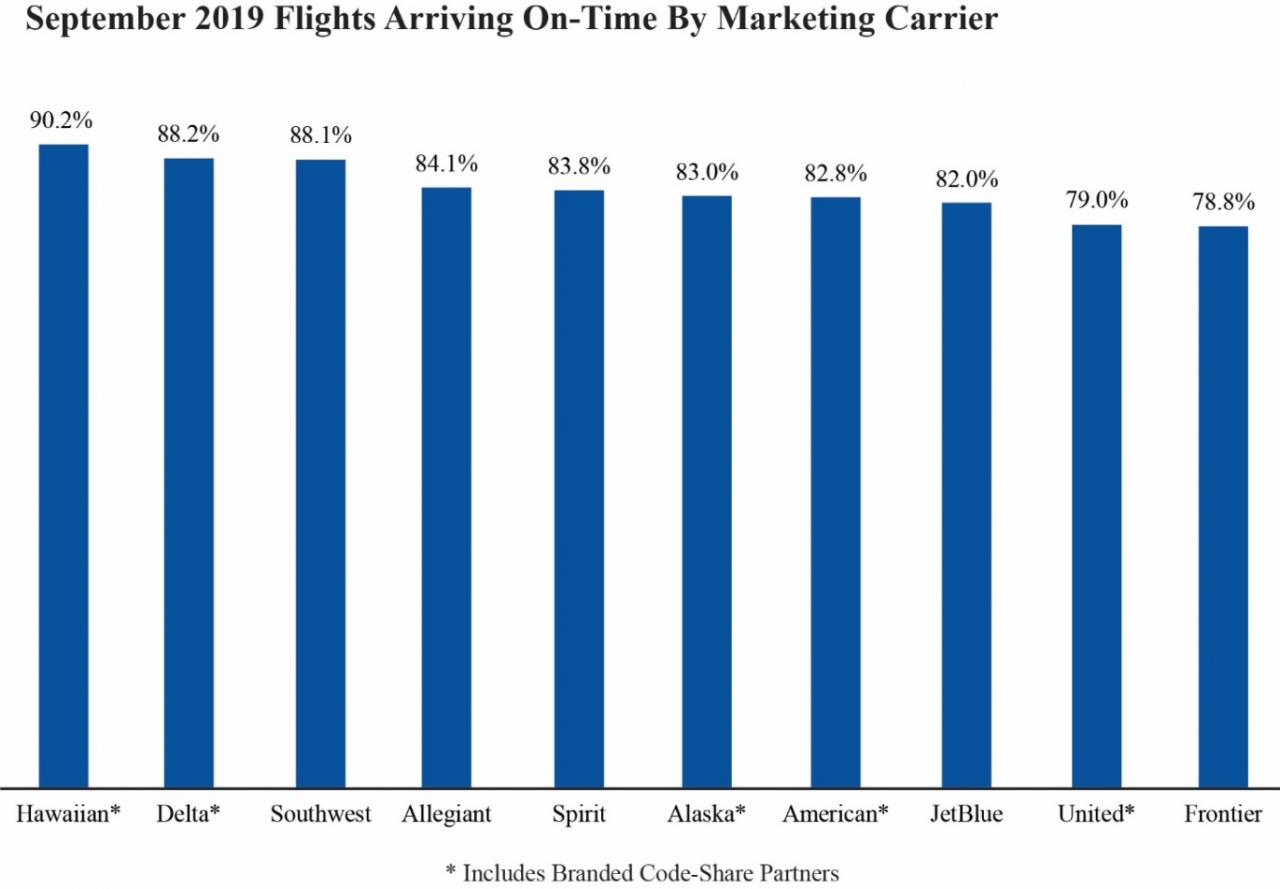
Highest Reporting Marketing Carrier On-Time Arrival Rates (ATCR Table 1)
- Hawaiian Airlines Network – 90.2%
- Delta Air Lines Network – 88.2%
- Southwest Airlines – 88.1%
Lowest Reporting Marketing Carrier On-Time Arrival Rates (ATCR Table 1)
- Frontier Airlines – 78.8%
- United Airlines Network – 79.0%
- JetBlue Airways – 82.0%
September Cancellations
In September 2019, reporting marketing carriers canceled 1.7% of their scheduled domestic flights, lower than the rate of 1.8% in August 2019, but higher than the rate of 1.5% in September 2018.
Lowest Reporting Marketing Carrier Rates of Canceled Flights (ATCR Table 6)
- Hawaiian Airlines Network – 0.4%
- Delta Air Lines Network – 0.4%
- Alaska Airlines Network – 0.9%
Highest Reporting Marketing Carrier Rates of Canceled Flights (ATCR Table 6)
- Spirit Airlines – 4.6%
- Allegiant Air – 2.5%
- Frontier Airlines – 2.5%
Tarmac Delays
In September 2019, airlines reported 11 tarmac delays of more than three hours on domestic flights, compared to 46 such tarmac delays reported in August 2019 and 11 tarmac delays reported in September 2018. In September 2019, airlines reported no tarmac delays of more than four hours on international flights, compared to two tarmac delays reported in August 2019 and two tarmac delays reported in September 2018. Extended tarmac delays are investigated by the Department.
Domestic Flights with Longest Tarmac Delays Exceeding Three Hours (ATCR Table 8)
- Alaska Airlines flight 485 from Sacramento, Calif. (SMF) to Seattle, Wash. (SEA), 9/7/19 – delayed 4 hours and 47 minutes on the tarmac at Everett, Wash. (PAE) after being diverted.
- Alaska Airlines flight 225 from San Diego, Calif. (SAN) to Seattle, Wash. (SEA), 9/7/19 – delayed 4 hours and 10 minutes on the tarmac at Everett, Wash. (PAE) after being diverted.
- Alaska Airlines flight 2489 (operated by Horizon Air) from Bozeman, Mont. (BZN) to Seattle, Wash. (SEA), 9/7/19 – delayed 3 hours and 56 minutes on the tarmac at Everett, Wash. (PAE) after being diverted.
International Flights with Longest Tarmac Delays Exceeding Four Hours (ATCR Table 8A)
There were no tarmac delays of more than four hours on international flights in September.
Mishandled Baggage
In September 2019, the reporting marketing carriers posted a mishandled baggage rate of 4.70 mishandled bags per 1,000 checked bags, a lower rate than the August 2019 rate of 6.06 per 1,000 checked bags. For the first nine months of the year, the carriers posted a mishandled baggage rate of 6.00 per 1,000 checked bags.
See the November 2019 Air Travel Consumer Report for mishandled baggage numbers by airline.
Mishandled Wheelchairs and Scooters
In September 2019, reporting marketing airlines reported checking 62,985 wheelchairs and scooters and mishandling 832, a rate of 1.32% mishandled, compared to the rate of 1.58% mishandled in August 2019. For the first nine months of the year, the carriers posted a mishandled wheelchair and scooter rate of 1.59%. In December 2018, DOT reported mishandled wheelchairs and scooters data for carriers for the first time.
See the November 2019 Air Travel Consumer Report for mishandled wheelchair and scooter numbers by airline.
Bumping/Oversales
Bumping/oversales data, unlike other air carrier data, are reported quarterly rather than monthly. In the third quarter of 2019, the 10 U.S. reporting marketing carriers posted an involuntary denied boarding, or bumping, rate of 0.19 per 10,000 passengers, a lower rate than the rate of 0.31 for the second quarter of 2019 but higher than the rate of 0.13 in the third quarter of 2018.
For the first nine months of 2019, the reporting marketing carriers posted a bumping rate of 0.27 per 10,000 passengers, a higher rate than the 0.13 rate for the same period last year.
See the November 2019 Air Travel Consumer Report for denied boarding numbers by airline.
Incidents Involving Animals
In September 2019, U.S. airlines reported three incidents involving the death, injury, or loss of an animal while traveling by air, up from both the one report filed in September 2018 and the one filed in August 2019. September’s incidents involved the death of one animal and injury to two other animals.
Complaints About Airline Service
In September 2019, DOT received 1,258 complaints about airline service from consumers, down 3.9% from the total of 1,309 filed in September 2018 and down 26.6% from the 1,713 received in August 2019.
For the first nine months of this year, the Department received 12,008 consumer complaints, down 1.1% from the total of 12,144 filed during the first nine months of 2018.
Complaints About Treatment of Disabled Passengers
In September 2019, the Department received a total of 66 disability-related complaints, up from the 48 complaints received in September 2018, but down from the 109 complaints received in August 2019.
For the first nine months of this year, the Department received 675 disability-related complaints, up 9.2% from the total of 618 filed during the first nine months of 2018.
Complaints About Discrimination
In September 2019, the Department received 12 complaints alleging discrimination – four regarding race, one regarding ancestry/ethnicity, two regarding national origin, two regarding color, one regarding sexual discrimination, and two categorized as “other.” This is up from both the eight complaints recorded in September 2018 and the 10 complaints received in August 2019.
From January to September 2019, the Division received 83 complaints from consumers alleging discrimination by airlines – 50 regarding race, one regarding ancestry/ethnicity, 12 regarding national origin, eight regarding color, four regarding religion, five regarding sexual discrimination, and three categorized as “other.” This is an increase from the 70 complaints alleging discrimination received during the first nine months of 2018.
All complaints alleging discrimination are investigated to determine if there has been a violation(s) of the passenger’s civil rights.
Consumers may file air travel consumer or civil rights complaints online at http://airconsumer.dot.gov/escomplaint/ConsumerForm.cfm, by voicemail at (202) 366-2220, or by TTY at (202) 366-0511. They may also mail a complaint to the Aviation Consumer Protection Division, U.S. Department of Transportation, C-75, W96-432, 1200 New Jersey Avenue, SE, Washington, DC 20590.
Consumers who want on-time performance data for specific flights should call their airline’s reservation number or their travel agent. This information is available on the computerized reservation systems used by these agents. The information is also available on the appropriate carrier’s website.
###
DOT 75-19