
Air Travel Consumer Report: November 2019 Numbers
WASHINGTON – The U.S. Department of Transportation (DOT) today released its January 2020 Air Travel Consumer Report (ATCR) on reporting marketing and operating air carrier data compiled for the month of November 2019. The full consumer report and other aviation consumer matters of interest to the public can be found at http://www.transportation.gov/airconsumer.
November On-Time Performance
In November 2019, reporting marketing carriers posted an on-time arrival rate of 84.4%, up from both the 82.2% on-time rate in October 2019 and 79.7% in November 2018.
For the first 11 months of 2019, the reporting marketing carriers posted an on-time arrival rate of 79.0%, down slightly from 79.1% for the same period in 2018.
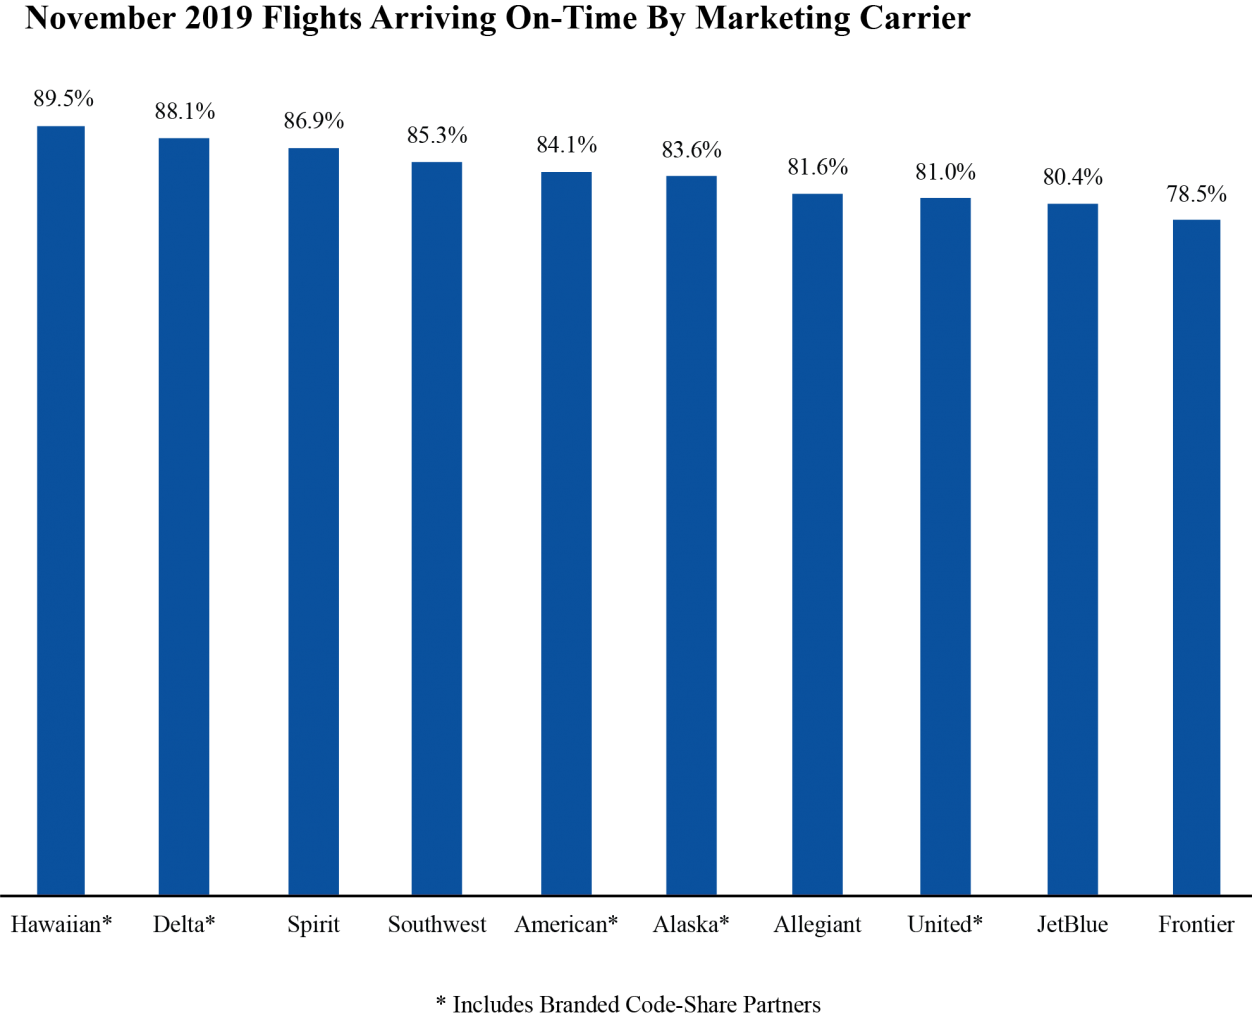
Highest Reporting Marketing Carrier On-Time Arrival Rates (ATCR Table 1)
- Hawaiian Air Lines Network – 89.5%
- Delta Air Lines Network – 88.1%
- Spirit Airlines – 86.9%
Lowest Reporting Marketing Carrier On-Time Arrival Rates (ATCR Table 1)
- Frontier Airlines – 78.5%
- JetBlue Airways – 80.4%
- United Airlines Network – 81.0%
November Cancellations
In November 2019, reporting marketing carriers canceled 0.8% of their scheduled domestic flights, a lower rate than both 0.9% in October 2019 and 1.1% in November 2018.
Lowest Reporting Marketing Carrier Rates of Canceled Flights (ATCR Table 6)
- JetBlue Airways – 0.1%
- Delta Air Lines Network – 0.2%
- Allegiant Air – 0.3%
Highest Reporting Marketing Carrier Rates of Canceled Flights (ATCR Table 6)
- United Airlines Network – 1.6%
- Alaska Airlines Network – 1.2%
- Southwest Airlines – 1.0%
Tarmac Delays
In November 2019, airlines reported five tarmac delays of more than three hours on domestic flights, compared to five such tarmac delays reported in October 2019 and 21 tarmac delays reported in November 2018. In November 2019, airlines reported no tarmac delays of more than four hours on international flights, compared to no tarmac delays reported in October 2019 and 12 tarmac delays reported in November 2018. Extended tarmac delays are investigated by the Department.
Domestic Flights with Longest Tarmac Delays Exceeding Three Hours (ATCR Table 8)
- Delta Air Lines flight 5782 (operated by Compass Airlines) from San Jose, Calif. (SJC) to Seattle (SEA), 11/25/19 – delayed 4 hours and 9 minutes on the San Jose tarmac.
- American Airlines flight 5875 (operated by Mesa Airlines) from Moline, Ill. (MLI) to Dallas-Fort Worth (DFW), 11/11/19 – delayed 3 hours and 8 minutes on the tarmac at Moline.
- Delta Air Lines flight 2846 from Detroit (DTW) to Newark, N.J. (EWR), 11/11/19 – delayed 3 hours and 3 minutes on the tarmac at Detroit.
International Flights with Longest Tarmac Delays Exceeding Four Hours (ATCR Table 8A)
There were no tarmac delays of more than four hours on international flights in October.
Mishandled Baggage
In November 2019, the reporting marketing carriers posted a mishandled baggage rate of 4.68 mishandled bags per 1,000 checked bags, a lower rate than the October 2019 rate of 4.77 per 1,000 checked bags.
See the January 2020 Air Travel Consumer Report for mishandled baggage numbers by airline.
Mishandled Wheelchairs and Scooters
In November 2019, reporting marketing airlines reported checking 62,468 wheelchairs and scooters and mishandling 887, a rate of 1.42% mishandled, compared to the rate of 1.29% mishandled in October 2019. In December 2018, DOT reported mishandled wheelchairs and scooters data for carriers for the first time.
See the January 2020 Air Travel Consumer Report for mishandled wheelchair and scooter numbers by airline.
Bumping/Oversales
Bumping/oversales data, unlike other air carrier data, are reported quarterly rather than monthly. Third quarter 2019 bumping/oversales data were released in the November 2019 Air Travel Consumer Report. Full year 2019 and fourth quarter 2019 bumping/oversales data will be available in the February 2020 Air Travel Consumer Report.
See the November 2019 Air Travel Consumer Report for denied boarding numbers by airline.
Incidents Involving Animals
In November 2019, U.S. airlines reported two incidents involving the death, injury, or loss of an animal while traveling by air, up from the zero incidents in both November 2018 and in October 2019. November’s incidents involved the death of one animal and injury to one other animal.
Complaints About Airline Service
In November 2019, DOT received 941 complaints about airline service from consumers, down 18.1% from the total of 1,149 filed in November 2018 and down 17.4% from the 1,139 received in October 2019.
Complaints About Treatment of Disabled Passengers
In November 2019, the Department received a total of 66 disability-related complaints, down from both the 73 complaints received in November 2018 and the 77 complaints received in October 2019.
Complaints About Discrimination
In November 2019, the Department received six complaints alleging discrimination – three regarding race, one regarding ancestry/ethnicity, one regarding national origin, and one regarding religion. This is down from both the 13 complaints recorded in November 2018, and the nine complaints received in October 2019.
All complaints alleging discrimination are investigated to determine if there has been a violation(s) of the passenger’s civil rights.
Consumers may file air travel consumer or civil rights complaints online at http://airconsumer.dot.gov/escomplaint/ConsumerForm.cfm. They may also mail a complaint to the Aviation Consumer Protection Division, U.S. Department of Transportation, C-75, W96-432, 1200 New Jersey Avenue, SE, Washington, DC 20590.
Consumers who want on-time performance data for specific flights should call their airline’s reservation number or their travel agent. This information is available on the computerized reservation systems used by these agents. The information is also available on the appropriate carrier’s website.
###