
Active Transportation and Health
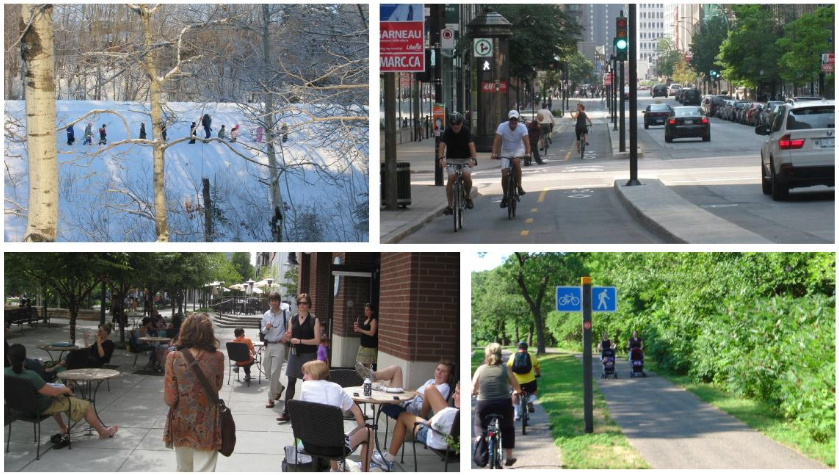
Almost a quarter of adults report that they do not engage in any physical activity outside of their jobs, and sedentary lifestyles are an important reason that two-thirds of U.S. adults are overweight or obese. By improving bicycle and pedestrian facilities, transportation agencies create opportunities for people to exercise recreationally and build exercise into their daily routine by bicycling or walking to work, shops, and services. Improving transit service produces similar results. Though transit is not typically thought of as a form of active transportation, studies have shown an increase in physical activity among transit riders because many people walk to or from stations or take other trips by foot during the course of a car-free day. In addition to investing in bicycle, pedestrian, and transit facilities, transportation agencies can strategically invest in projects that support mixed-use neighborhoods with many different destinations within walking distance of one another. Investing in transit, bicycle, and pedestrian facilities not only creates opportunities for people to exercise and reduces obesity but also reduces the risk of associated conditions such as diabetes, cardiovascular disease, and premature death. These investments are particularly important in low-income communities and communities of color, where residents are less likely to own vehicles, but where inadequate facilities may pose a barrier to using active transportation.
Related indicators in the Transportation and Health Tool
Commute mode share describes the percentage of workers who use active transportation to travel to work either via transit, bicycle, or foot.
Miles traveled by mode describes the relative length that people travel using active transportation.
Vehicle miles traveled per capita provides a measure of how much the average person drives; lower VMT per capita can indicate that active transportation is a viable alternative to driving.
Physical activity from transportation describes the percentage of trips taken by residents that include at least 10 minutes of active transportation.
Walkability describes whether key destinations, such as grocery stores and recreational facilities, are available within walking distance of a given location; high walkability indicates a greater likelihood that residents will be able to make trips by foot or by bicycle.
Use of Federal funds for bicycle and pedestrian efforts describes the extent to which transportation agencies are using discretionary federal funding to create or improve active transportation facilities.
Complete streets policies, plans, and projects describe the extent and effectiveness of policies to create streets that accommodate cyclists, pedestrians, and traffic riders alongside of vehicles.
Resources
National Complete Streets Coalition Policy Atlas
The National Complete Streets Coalition Policy Atlas inventories complete streets policies across the U.S., providing an interactive mapping tool that shows the location of jurisdictions with these policies as well as detailed information on how policies are adopted and implemented and analysis of the strength of various policies...
Housing and Transportation Affordability Index
The Housing and Transportation Affordability Index estimates combined housing and transportation costs based on many different transportation and land use variables. It includes neighborhood-level data on many factors related to active transportation, such as transit access, pedestrian connectivity, and block length...
Walk Score
Walk Score rates the walkability of locations based on their proximity to key destinations, such as stores and recreational facilities. Two new tools available through the site, Street Smart Walk Score and Transit Score, provide additional information on the quality of the pedestrian environment and proximity to transit...
Research Studies
Travel and the Built Environment: A Meta-Analysis
Describes how factors in the built environment, including access to transit and intersection density, affect rates of transit use and walking.
Ewing, R., and Cervero, R. (2010). Travel and the Built Environment: A Meta-Analysis. Journal of the American Planning Association, 76(3), 265-294.
Understanding the Relationship Between Public Health and the Built Environment: A Report Prepared for the LEED-ND Core Committee
Summarizes research on how active transportation and transit use improves health, and describes the different ways in which the built environment can affect physical activity.
Design, Community & Environment; Ewing, R.; Lawrence Frank and Company, Inc.; and Kreutzer, R. (2006). Understanding the Relationship Between Public Health and the Built Environment: A Report Prepared for the LEED-ND Core Committee.
The Planning Perspective on Health: Community Health as a Goal of Good Design
Summarizes research on the health impacts of different transportation modes and describes how planning decisions impact health through transportation behavior.
ChangeLab Solutions. The Planning Perspective on Health: Community Health as a Goal of Good Design.
Walking and Cycling in the United States, 2001–2009: Evidence From the National Household Travel Surveys
Describes current trends in active transportation by mode and trip purpose for several different population subgroups, and discusses the implications for transportation planning and policy.
Pucher, J., Buehler, R., Merom, D., Bauman, A. (2011). Walking and Cycling in the United States, 2001–2009: Evidence From the National Household Travel Surveys. American Journal of Public Health: 101(S1), S310-S317.
Walking and Cycling to Health: A Comparative Analysis of City, State, and International Data
Analyzes transportation and health data from different locations to identify the relationship between active travel and rates of physical activity, obesity, and diabetes.
Pucher, J., Buehler, R., Bassett, D., and Dannenberg, L (2010). Walking and Cycling to Health: A Comparative Analysis of City, State, and International Data. American Journal of Public Health 100(10), 1,986-1,992.
Neighborhood-Based Differences in Physical Activity: An Environment Scale Evaluation
Examines the relationship between neighborhood environment, physical activity, and the number of overweight residents by comparing surveys and accelerometer data from a walkable and non-walkable neighborhood.
Saelens, B., Sallis, J., Black, J., and Chen, D. (2003). Neighborhood-Based Differences in Physical Activity: An Environment Scale Evaluation. American Journal of Public Health 93(9), 1,552-1,558.
Walking, Bicycling, and Urban Landscapes: Evidence From the San Francisco Bay Area
Evaluates the effect that aspects of the transportation system and built environment have on walking and bicycling trips using travel survey data.
Cervero, R., and Duncan, M. (2003). Walking, Bicycling, and Urban Landscapes: Evidence From the San Francisco Bay Area. American Journal of Public Health 93(9), 1,478-1,483.